





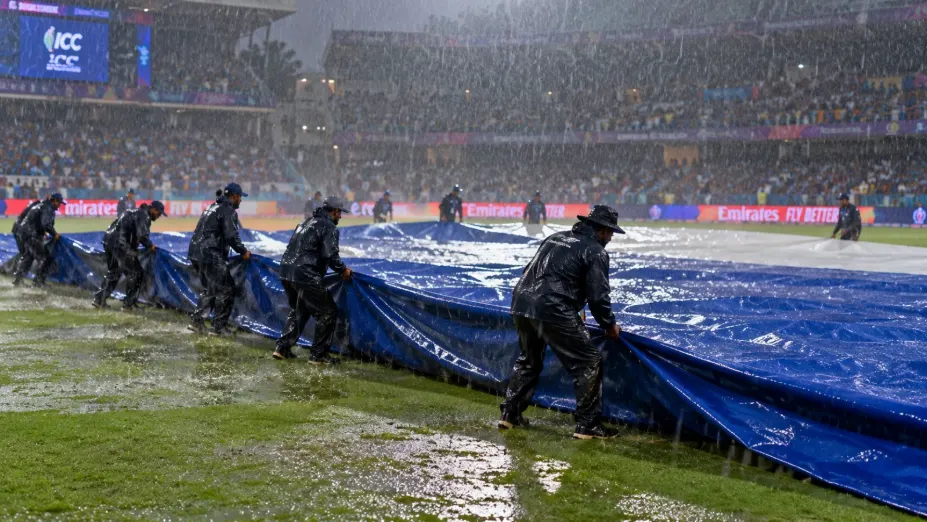
A statistician’s table of overs and wickets decides who wins when the covers come on, and the numbers behind it explain why chasing teams sometimes feel short-changed
Everyone who has watched cricket in the monsoon knows the feeling. Dark clouds roll in, the players jog off, and fans reach for their phones to learn what the new target will be. The figure that appears seems to come from nowhere. It comes from a method built on one idea: a batting side has two things to spend, and the target should reflect how much of each is left.
The Night That Broke the Old Rules
Before 1999, rain rules in international cricket were crude. The most infamous failure came in the 1992 World Cup semi-final in Sydney. South Africa needed 22 runs from 13 balls when rain stopped play, and the old method removed only the lowest-scoring overs of the first innings from England’s total. When the match restarted, the scoreboard showed South Africa needing 22 runs from a single ball. The result looked absurd and the sport needed something better.
Two Statisticians and One Big Idea
The answer came from two English statisticians, Frank Duckworth and Tony Lewis, who produced a method first used in 1997 and adopted by the ICC in 1999. Their insight was that a team’s batting potential is not only about the overs left. It also depends on the wickets in hand. A side with 20 overs left and all ten wickets standing can attack freely, while a side with the same 20 overs and seven wickets gone must stay careful. Both things are resources, and the method puts them on a single scale.
Spending Overs and Wickets
At the start of an innings, a team holds 100 percent of its resources. As overs pass and wickets fall, that percentage drops, and a published table records exactly how much remains for any combination. A side that has lost no wickets in the first ten overs has used up far less than one that has lost four, even though both have faced the same number of balls. The table was built from analysis of a huge number of real matches, so it reflects how scoring actually unfolds.
A Worked Example
Picture a team that scores 300 in a full 50 overs, using all of its resources. Rain then cuts the chasing side’s innings to 40 overs. Under the standard table, 40 overs with ten wickets in hand corresponds to roughly 90 percent of the resources. The chasing target is the first score multiplied by the ratio of the two resources, which gives about 270. A side that had to start its innings with only 90 percent of the batting potential is asked for only 90 percent of the runs.
Why the Formula Was Updated
The original tables reflected the scoring rates of the 1990s. As batters grew more aggressive and totals climbed, the method started to underestimate what a team with plenty of wickets could achieve, and the formula was modified. Steven Stern, a statistician from Australia, updated it in 2014, and the revised version is known as Duckworth-Lewis-Stern. It carries a rate that grows with how high the first innings total was, which brings the expected pace of scoring closer to modern cricket.
The Complaints That Won’t Die
The method has its critics. It produces a target from averages, and no average can capture a specific pitch, an exceptional batter or a dew-soaked outfield. Teams chasing also face a tougher task when the innings is cut short, since they must hit harder with less time to recover from a lost wicket. Fans often find it hard to follow because the number can change several times during a single interruption.
India has produced its own alternative. V Jayadevan, an engineer from Kerala, proposed a competing method, known as VJD, which has been used in some domestic tournaments in India. It works on a different statistical basis, though the international game has stayed with Duckworth-Lewis-Stern.
What to Watch the Next Time It Rains
When a stoppage comes, look at two numbers on the screen: the overs remaining and the wickets in hand. If the chasing side has lost few wickets, it keeps a large share of its resources, and the revised target will be higher than the run rate alone suggests. If it has lost several, the target softens, because the side has less batting left to spend. The number that appears on the screen is less mysterious than it looks.